Unlocking Actionable Insights
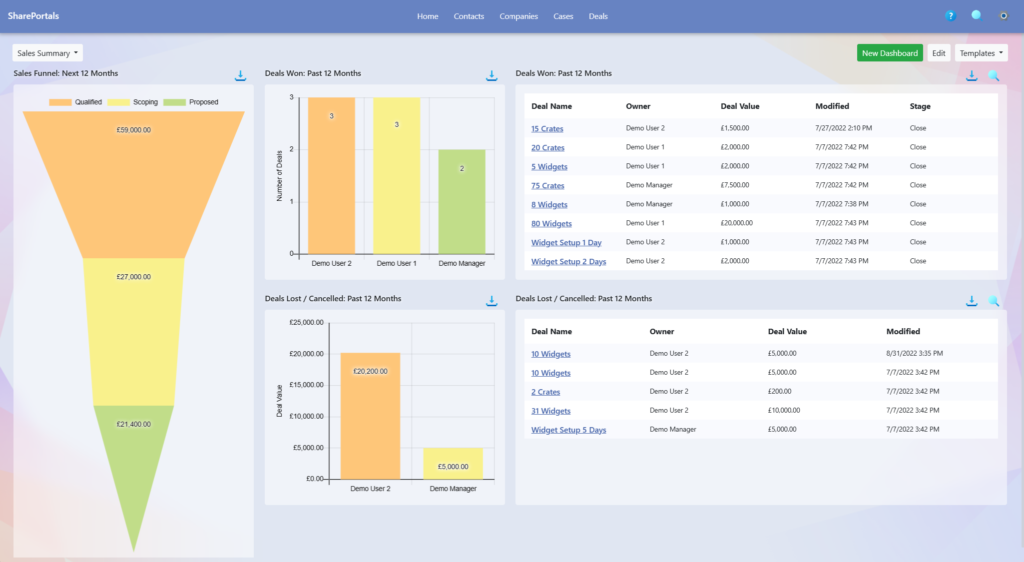
Shareportals Charts provide you with real-time insights into your data, helping you make informed decisions for any type of record. Microsoft Power BI allows you to go one step further.


Charts get live information from the SharePoint data under the hood, giving you a current picture.
Chart definitions are highly configurable from the basics like pie charts, to more advanced funnels and filters.
System dashboards can be configured by managers, and personal dashboards for each user to taillor their experience of charts and other widgets.
Power BI takes things to the next level for businesses who want sophisticated reports and dashboards, such as connecting to other datasets inside or outside of Microsoft 365.
© Betasoft Limited | Terms & Conditions | Privacy Policy
| Cookie | Duration | Description |
|---|---|---|
| cookielawinfo-checkbox-analytics | 11 months | This cookie is set by GDPR Cookie Consent plugin. The cookie is used to store the user consent for the cookies in the category "Analytics". |
| cookielawinfo-checkbox-functional | 11 months | The cookie is set by GDPR cookie consent to record the user consent for the cookies in the category "Functional". |
| cookielawinfo-checkbox-necessary | 11 months | This cookie is set by GDPR Cookie Consent plugin. The cookies is used to store the user consent for the cookies in the category "Necessary". |
| cookielawinfo-checkbox-others | 11 months | This cookie is set by GDPR Cookie Consent plugin. The cookie is used to store the user consent for the cookies in the category "Other. |
| cookielawinfo-checkbox-performance | 11 months | This cookie is set by GDPR Cookie Consent plugin. The cookie is used to store the user consent for the cookies in the category "Performance". |
| viewed_cookie_policy | 11 months | The cookie is set by the GDPR Cookie Consent plugin and is used to store whether or not user has consented to the use of cookies. It does not store any personal data. |